five_parameter_logistic_regression_parameter_scans
five_parameter_logistic_regression_parameter_scans.RmdFormula:
\(FI = dd + \frac{aa-dd}{(1+(\frac{Conc}{cc})^{bb})^{ee}}\)
Refs
https://laustep.github.io/stlahblog/posts/5pl.html
#Formula:
#FI = dd + (aa - dd) / ((1 + (Conc / cc)^-bb))^ee

# formula as function:
pl5 <- function (aa,bb,cc,dd,ee, Conc) {
  # provide concentration (Conc) and parameter (aa,bb,cc,dd,ee)
  # return fluorescence intensity (FI)
  FI = dd + (aa - dd) / ((1 + (Conc / cc)^bb))^ee
  return(FI)
}

# moderate (default, arbitrary) parameter values
dd <- 1
aa <- 2e5
cc <- 500
bb <- -1
ee <- 1

# range of Concentrations, different step size in different ranges
Conc <- c(seq(0,     0.01,  0.0001),
          seq(0.01,  0.1,   0.001),
          seq(0.1,   1,     0.01),
          seq(1,     10,    0.1),
          seq(10,    100,   1),
          seq(100,   1000,  10),
          seq(1000,  10000, 100),
          seq(10000, 1e5,   1000))

# common lines for plotting
gg_std <-
  ggplot() +
  scale_y_log10(label = fcexpr::sci10, breaks = c(1,10,1e3,1e5)) +
  scale_x_log10(label = fcexpr::sci10, breaks = c(1e-1,1e1,1e3,1e5)) +
  theme_bw()
Single parameter scans
dd
scan_range <- c(1:10)
scan <- do.call(rbind, lapply(scan_range, function(dd) {
  data.frame(FI = sapply(Conc, function(x) pl5(aa=aa,bb=bb,cc=cc,dd=dd,ee=ee,Conc=x)),
             aa=aa,
             bb=bb,
             cc=cc,
             dd=dd,
             ee=ee,
             Conc=Conc)
}))
scan$dd <- as.factor(scan$dd)

gg_std +
  geom_line(data = scan, aes(x = Conc, y = FI, color = dd)) +
  labs(title = paste0("aa = ",aa, ", bb = ", bb, ", cc = ", cc, ", ee = ",ee))
#> Warning: Transformation introduced infinite values in continuous x-axis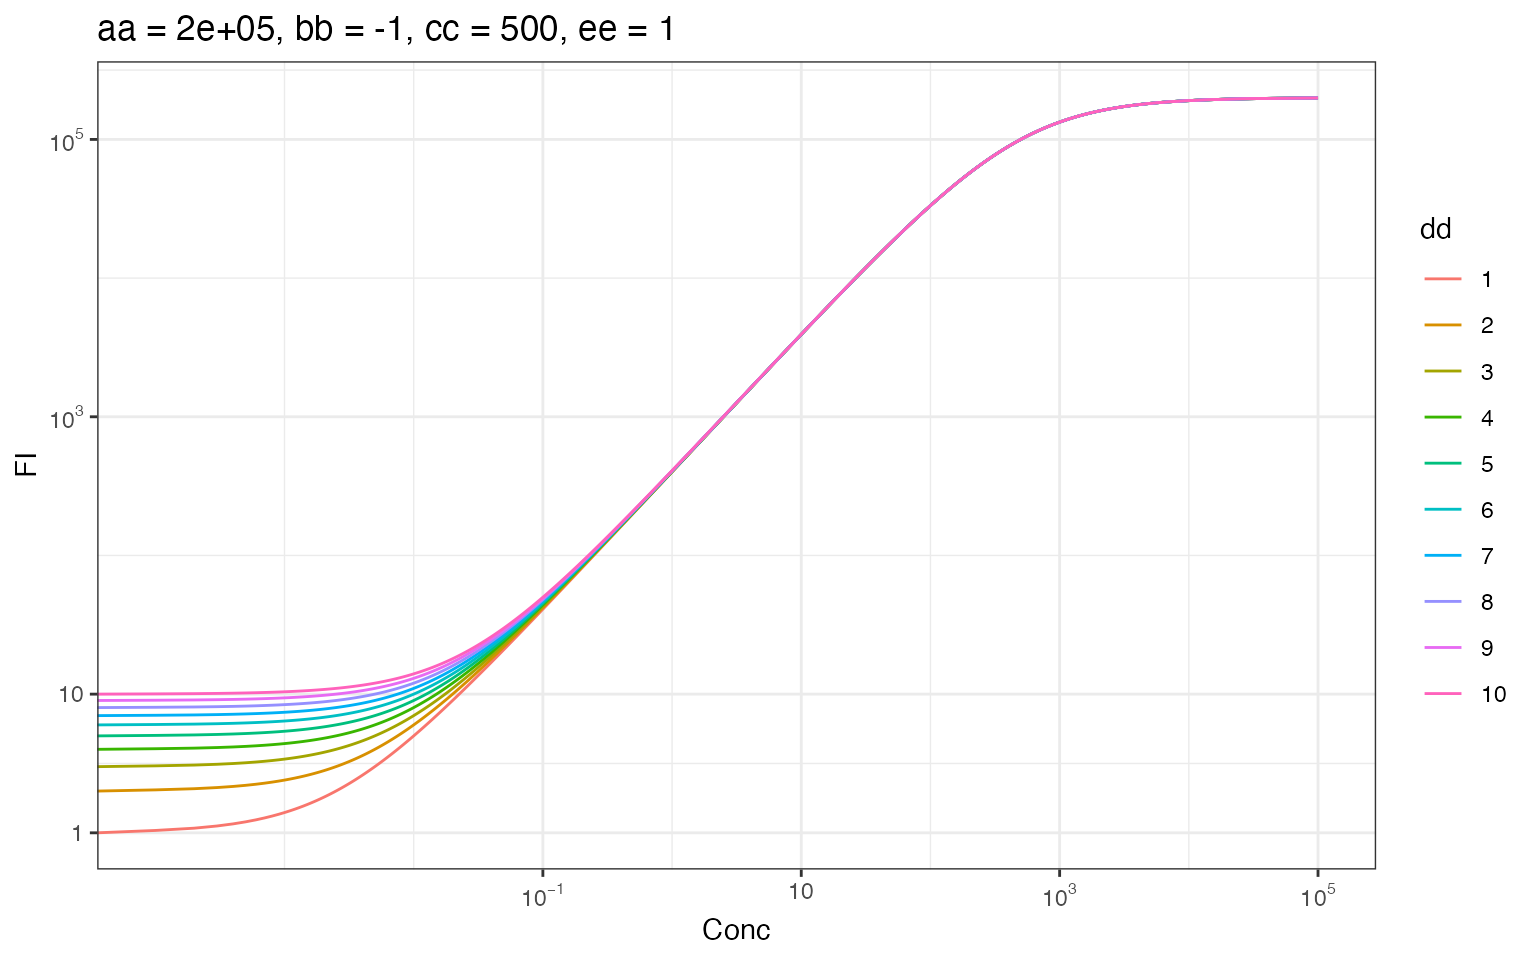
aa
scan_range <- c(5e4,1e5,2e5,3e5,5e5,1e6)
scan <- do.call(rbind, lapply(scan_range, function(aa) {
  data.frame(FI = sapply(Conc, function(x) pl5(aa=aa,bb=bb,cc=cc,dd=dd,ee=ee,Conc=x)),
             aa=aa,
             bb=bb,
             cc=cc,
             dd=dd,
             ee=ee,
             Conc=Conc)
}))
scan$aa <- as.factor(scan$aa)

gg_std +
  geom_line(data = scan, aes(x = Conc, y = FI, color = aa)) +
  labs(title = paste0("dd = ",dd, ", bb = ", bb, ", cc = ", cc, ", ee = ",ee))
#> Warning: Transformation introduced infinite values in continuous x-axis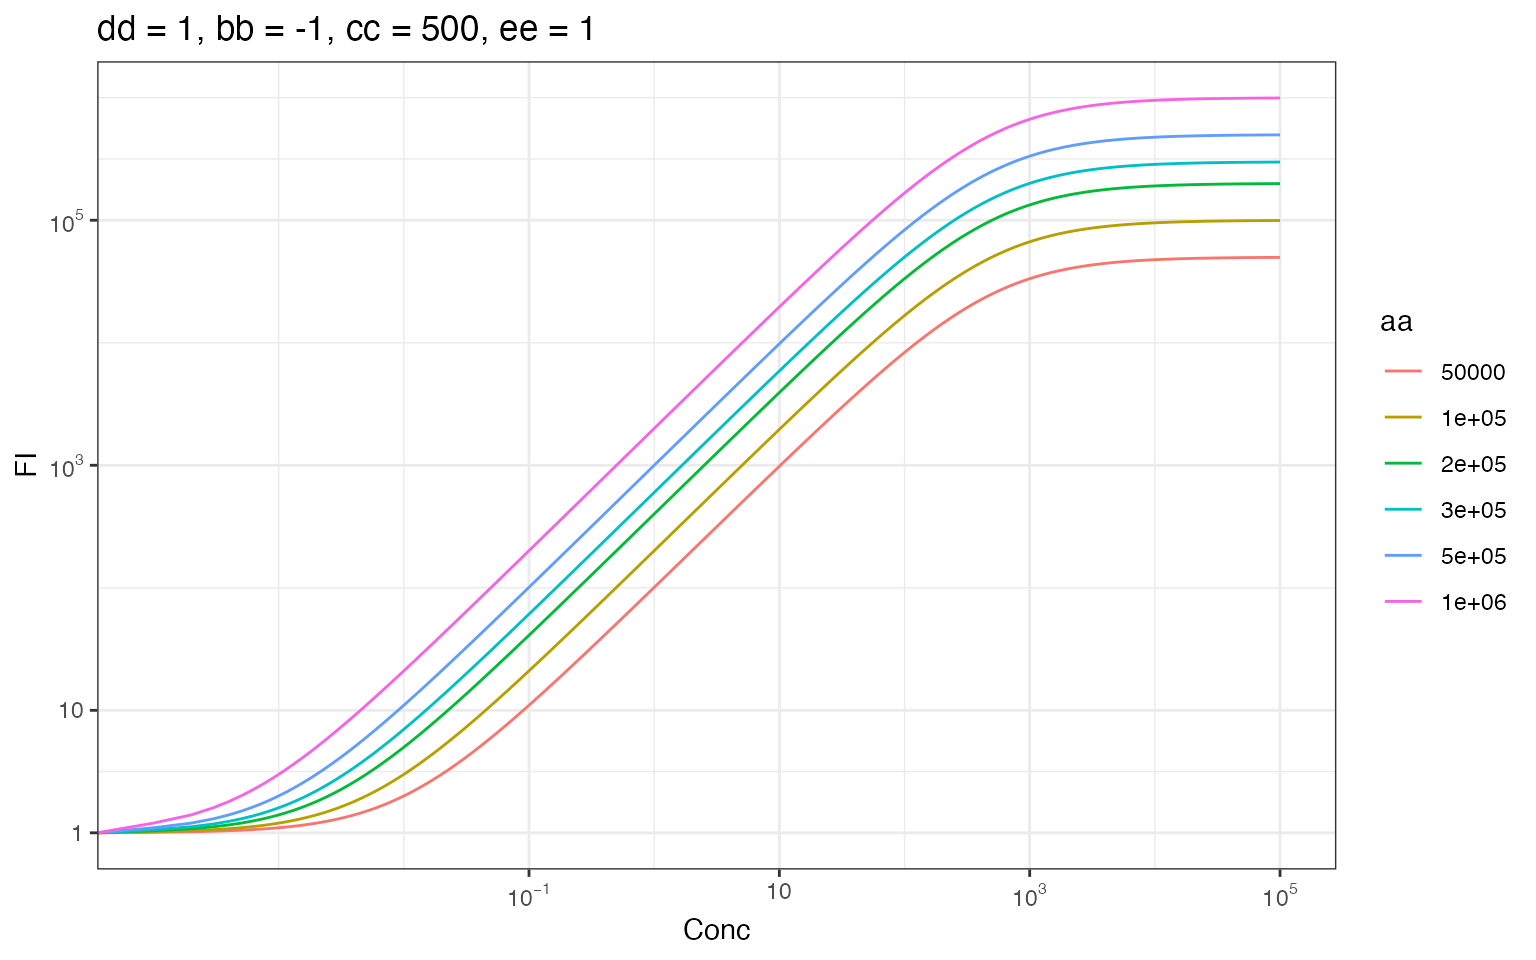
bb
scan_range <- c(-5,-3,-2,-1,1,2,3,5)
scan <- do.call(rbind, lapply(scan_range, function(bb) {
  data.frame(FI = sapply(Conc, function(x) pl5(aa=aa,bb=bb,cc=cc,dd=dd,ee=ee,Conc=x)),
             aa=aa,
             bb=bb,
             cc=cc,
             dd=dd,
             ee=ee,
             Conc=Conc)
}))
scan$bb <- as.factor(scan$bb)

gg_std +
  geom_line(data = scan, aes(x = Conc, y = FI, color = bb)) +
  labs(title = paste0("dd = ",dd, ", aa = ", aa, ", cc = ", cc, ", ee = ",ee))
#> Warning: Transformation introduced infinite values in continuous x-axis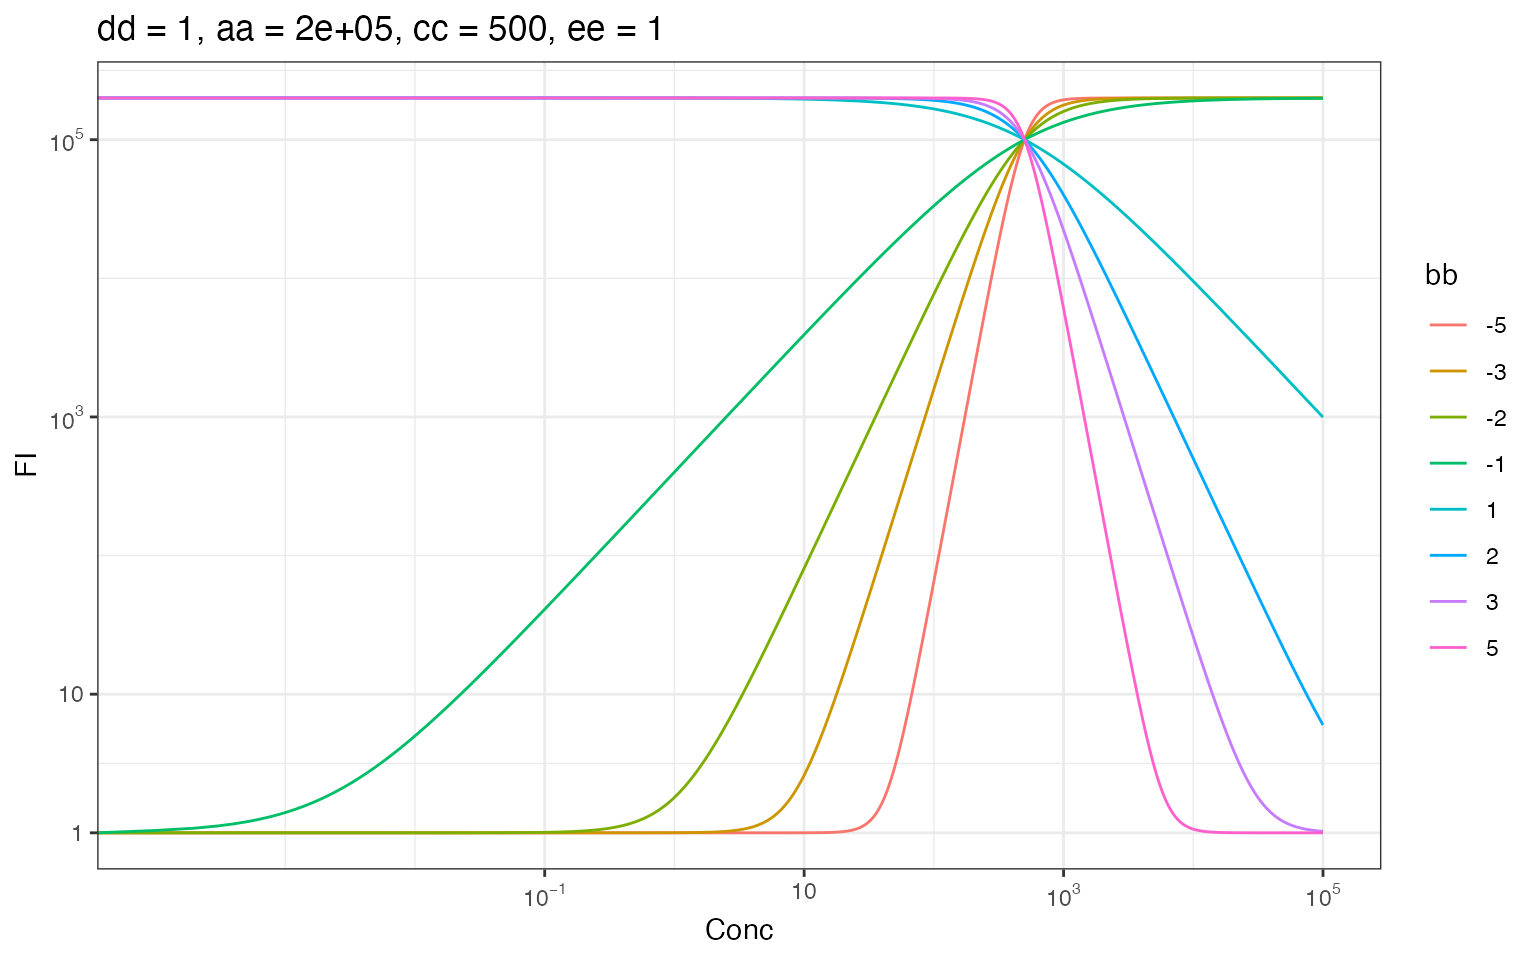
cc
scan_range <- c(50,100,200,500,1000,1e4)
scan <- do.call(rbind, lapply(scan_range, function(cc) {
  data.frame(FI = sapply(Conc, function(x) pl5(aa=aa,bb=bb,cc=cc,dd=dd,ee=ee,Conc=x)),
             aa=aa,
             bb=bb,
             cc=cc,
             dd=dd,
             ee=ee,
             Conc=Conc)
}))
scan$cc <- as.factor(scan$c)

gg_std +
  geom_line(data = scan, aes(x = Conc, y = FI, color = cc)) +
  labs(title = paste0("dd = ",dd, ", aa = ", aa, ", bb = ", bb, ", ee = ",ee))
#> Warning: Transformation introduced infinite values in continuous x-axis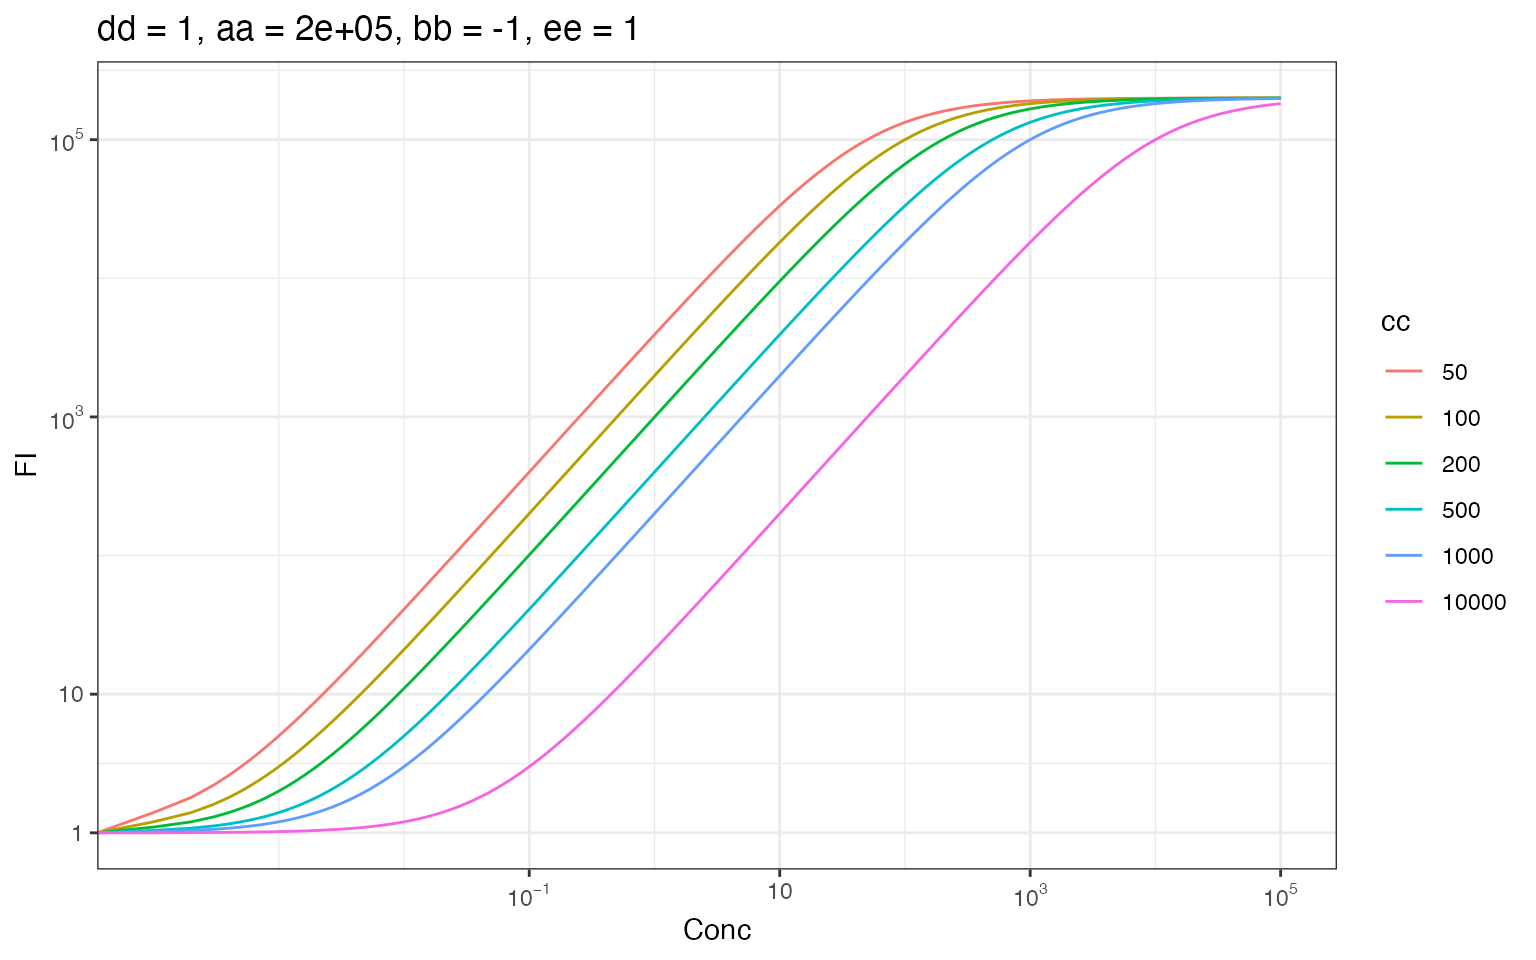
ee
scan_range <- c(1,1.5,2,2.5,3,5,10)
scan <- do.call(rbind, lapply(scan_range, function(ee) {
  data.frame(FI = sapply(Conc, function(x) pl5(aa=aa,bb=bb,cc=cc,dd=dd,ee=ee,Conc=x)),
             aa=aa,
             bb=bb,
             cc=cc,
             dd=dd,
             ee=ee,
             Conc=Conc)
}))
scan$ee <- as.factor(scan$ee)

gg_std +
  geom_line(data = scan, aes(x = Conc, y = FI, color = ee)) +
  labs(title = paste0("dd = ",dd, ", aa = ", aa, ", bb = ", bb, ", cc = ",cc))
#> Warning: Transformation introduced infinite values in continuous x-axis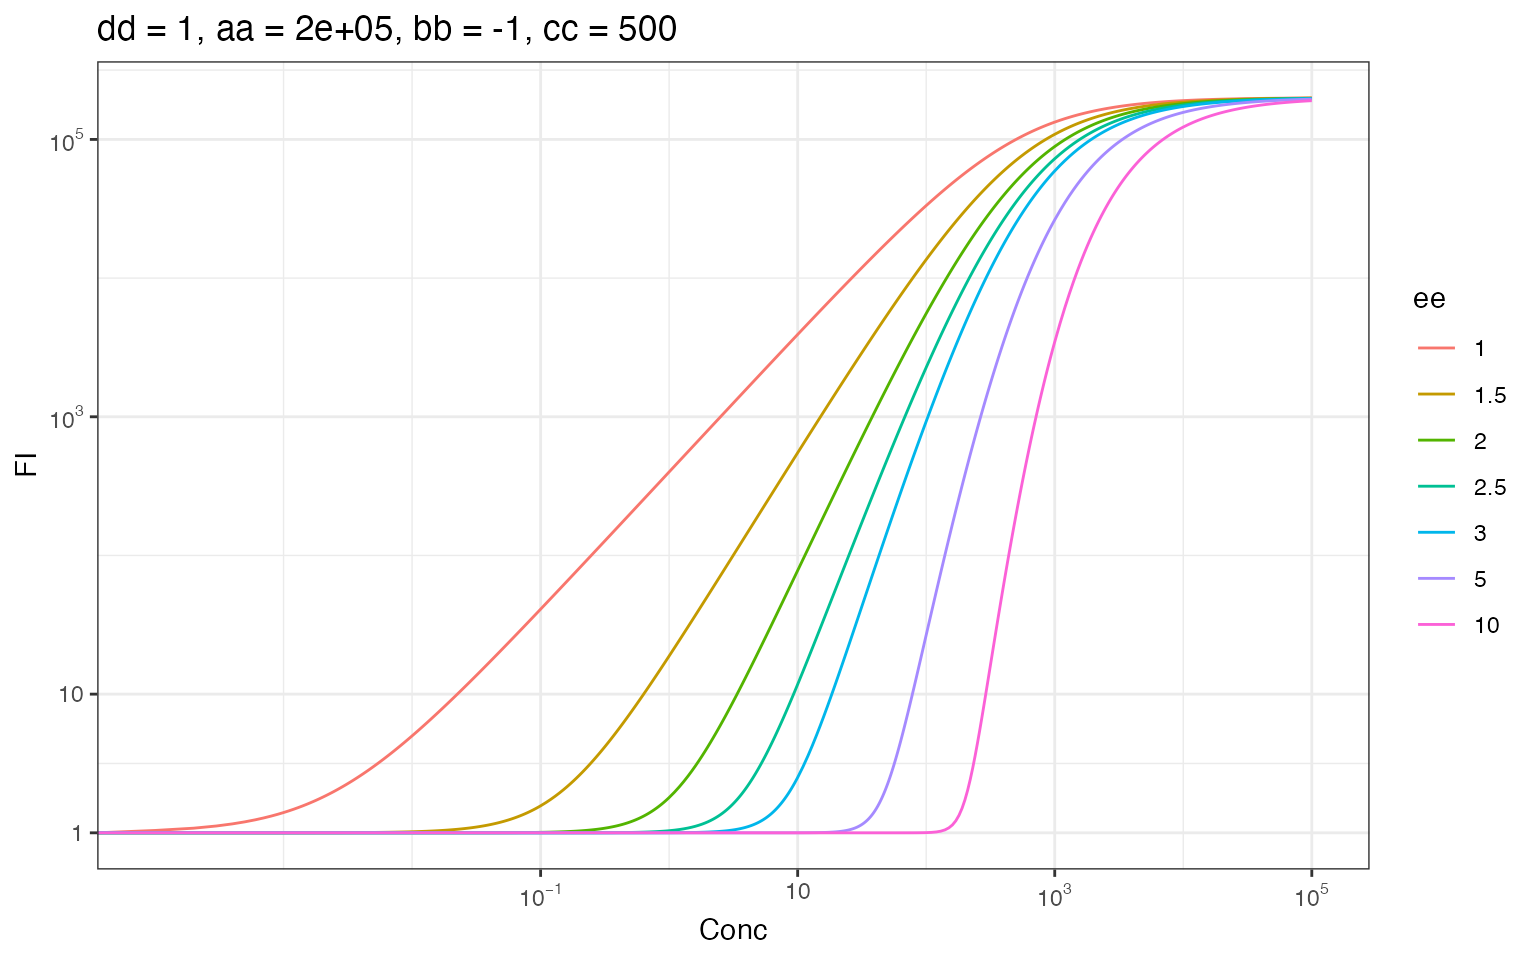
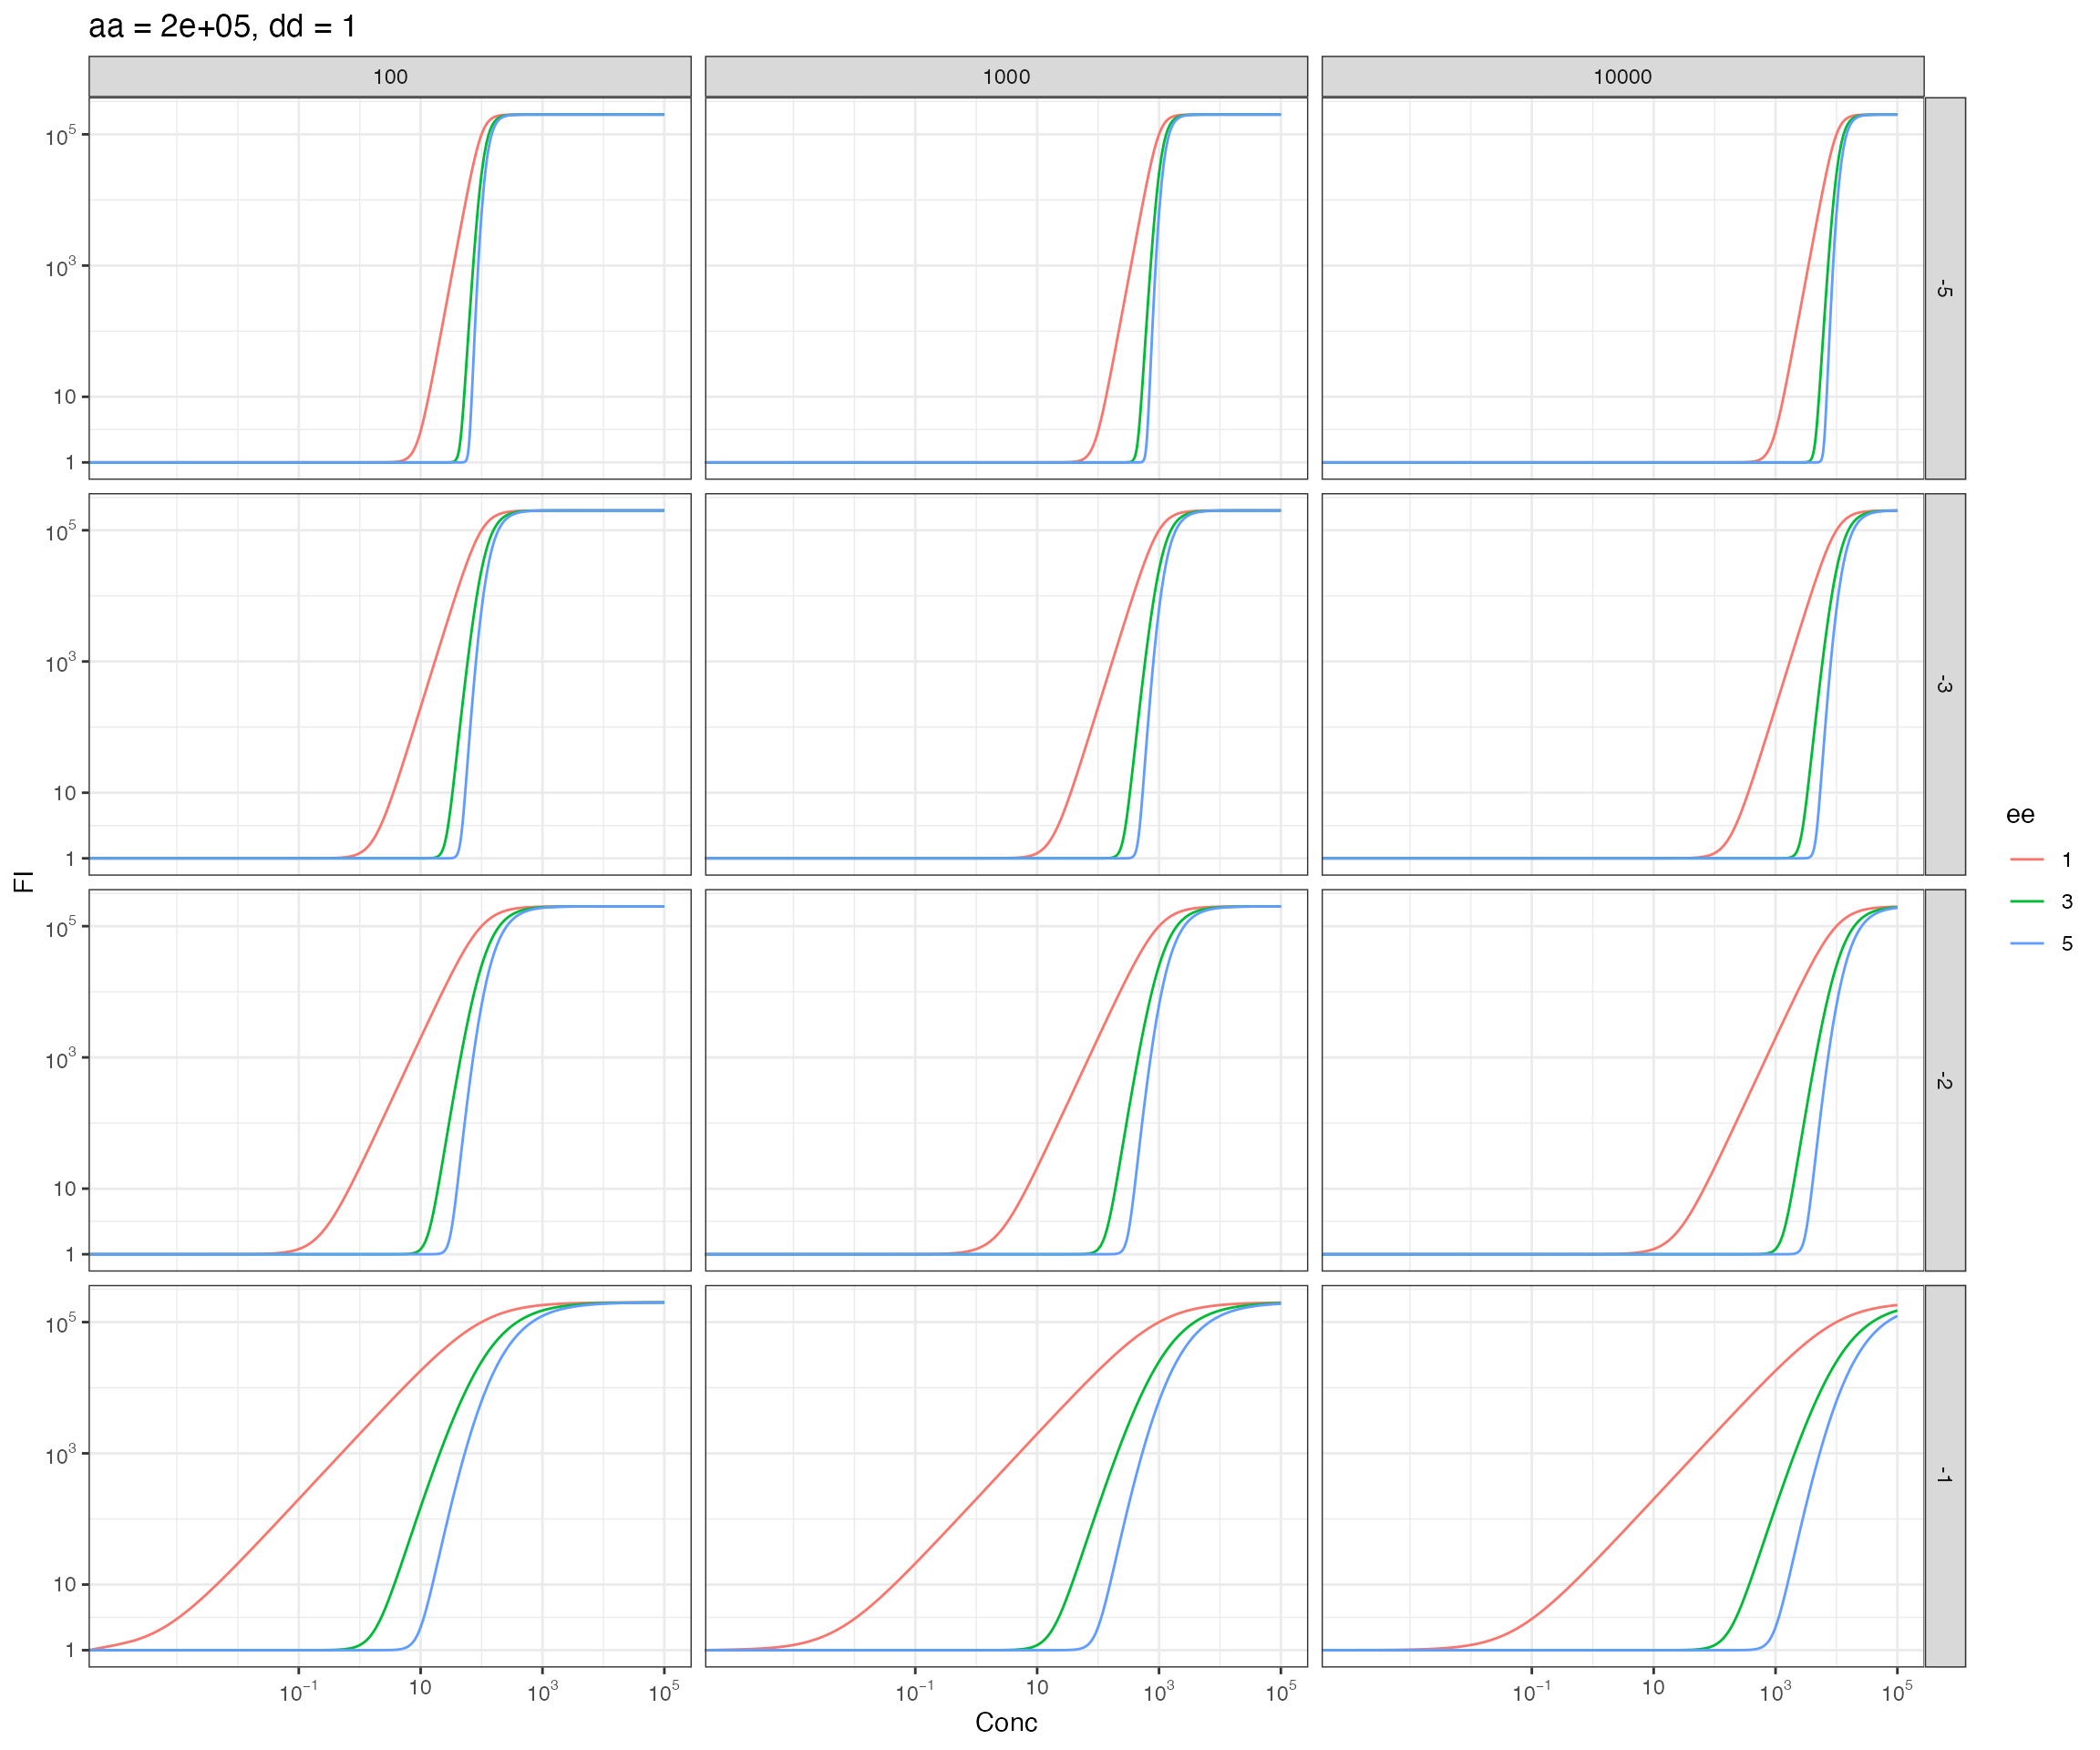
bb, cc and ee in parallel
scan <- do.call(rbind,lapply(c(100,1000,1e4), function(cc) {
  do.call(rbind,lapply(c(1,3,5), function(ee) {
    do.call(rbind,lapply(c(-5,-3,-2,-1), function(bb) {
      data.frame(FI = sapply(Conc, function(x) pl5(aa=aa,bb=bb,cc=cc,dd=dd,ee=ee,Conc=x)),
                 aa=aa,
                 bb=bb,
                 cc=cc,
                 dd=dd,
                 ee=ee,
                 Conc=Conc)
    }))
  }))
}))
scan$bb <- as.factor(scan$bb)
scan$cc <- as.factor(scan$cc)
scan$ee <- as.factor(scan$ee)

gg_std +
  geom_line(data = scan, aes(x = Conc, y = FI, color = bb)) +
  labs(title = paste0("aa = ",aa, ", dd = ", dd)) +
  facet_grid(rows = vars(cc), cols = vars(ee))
#> Warning: Transformation introduced infinite values in continuous x-axis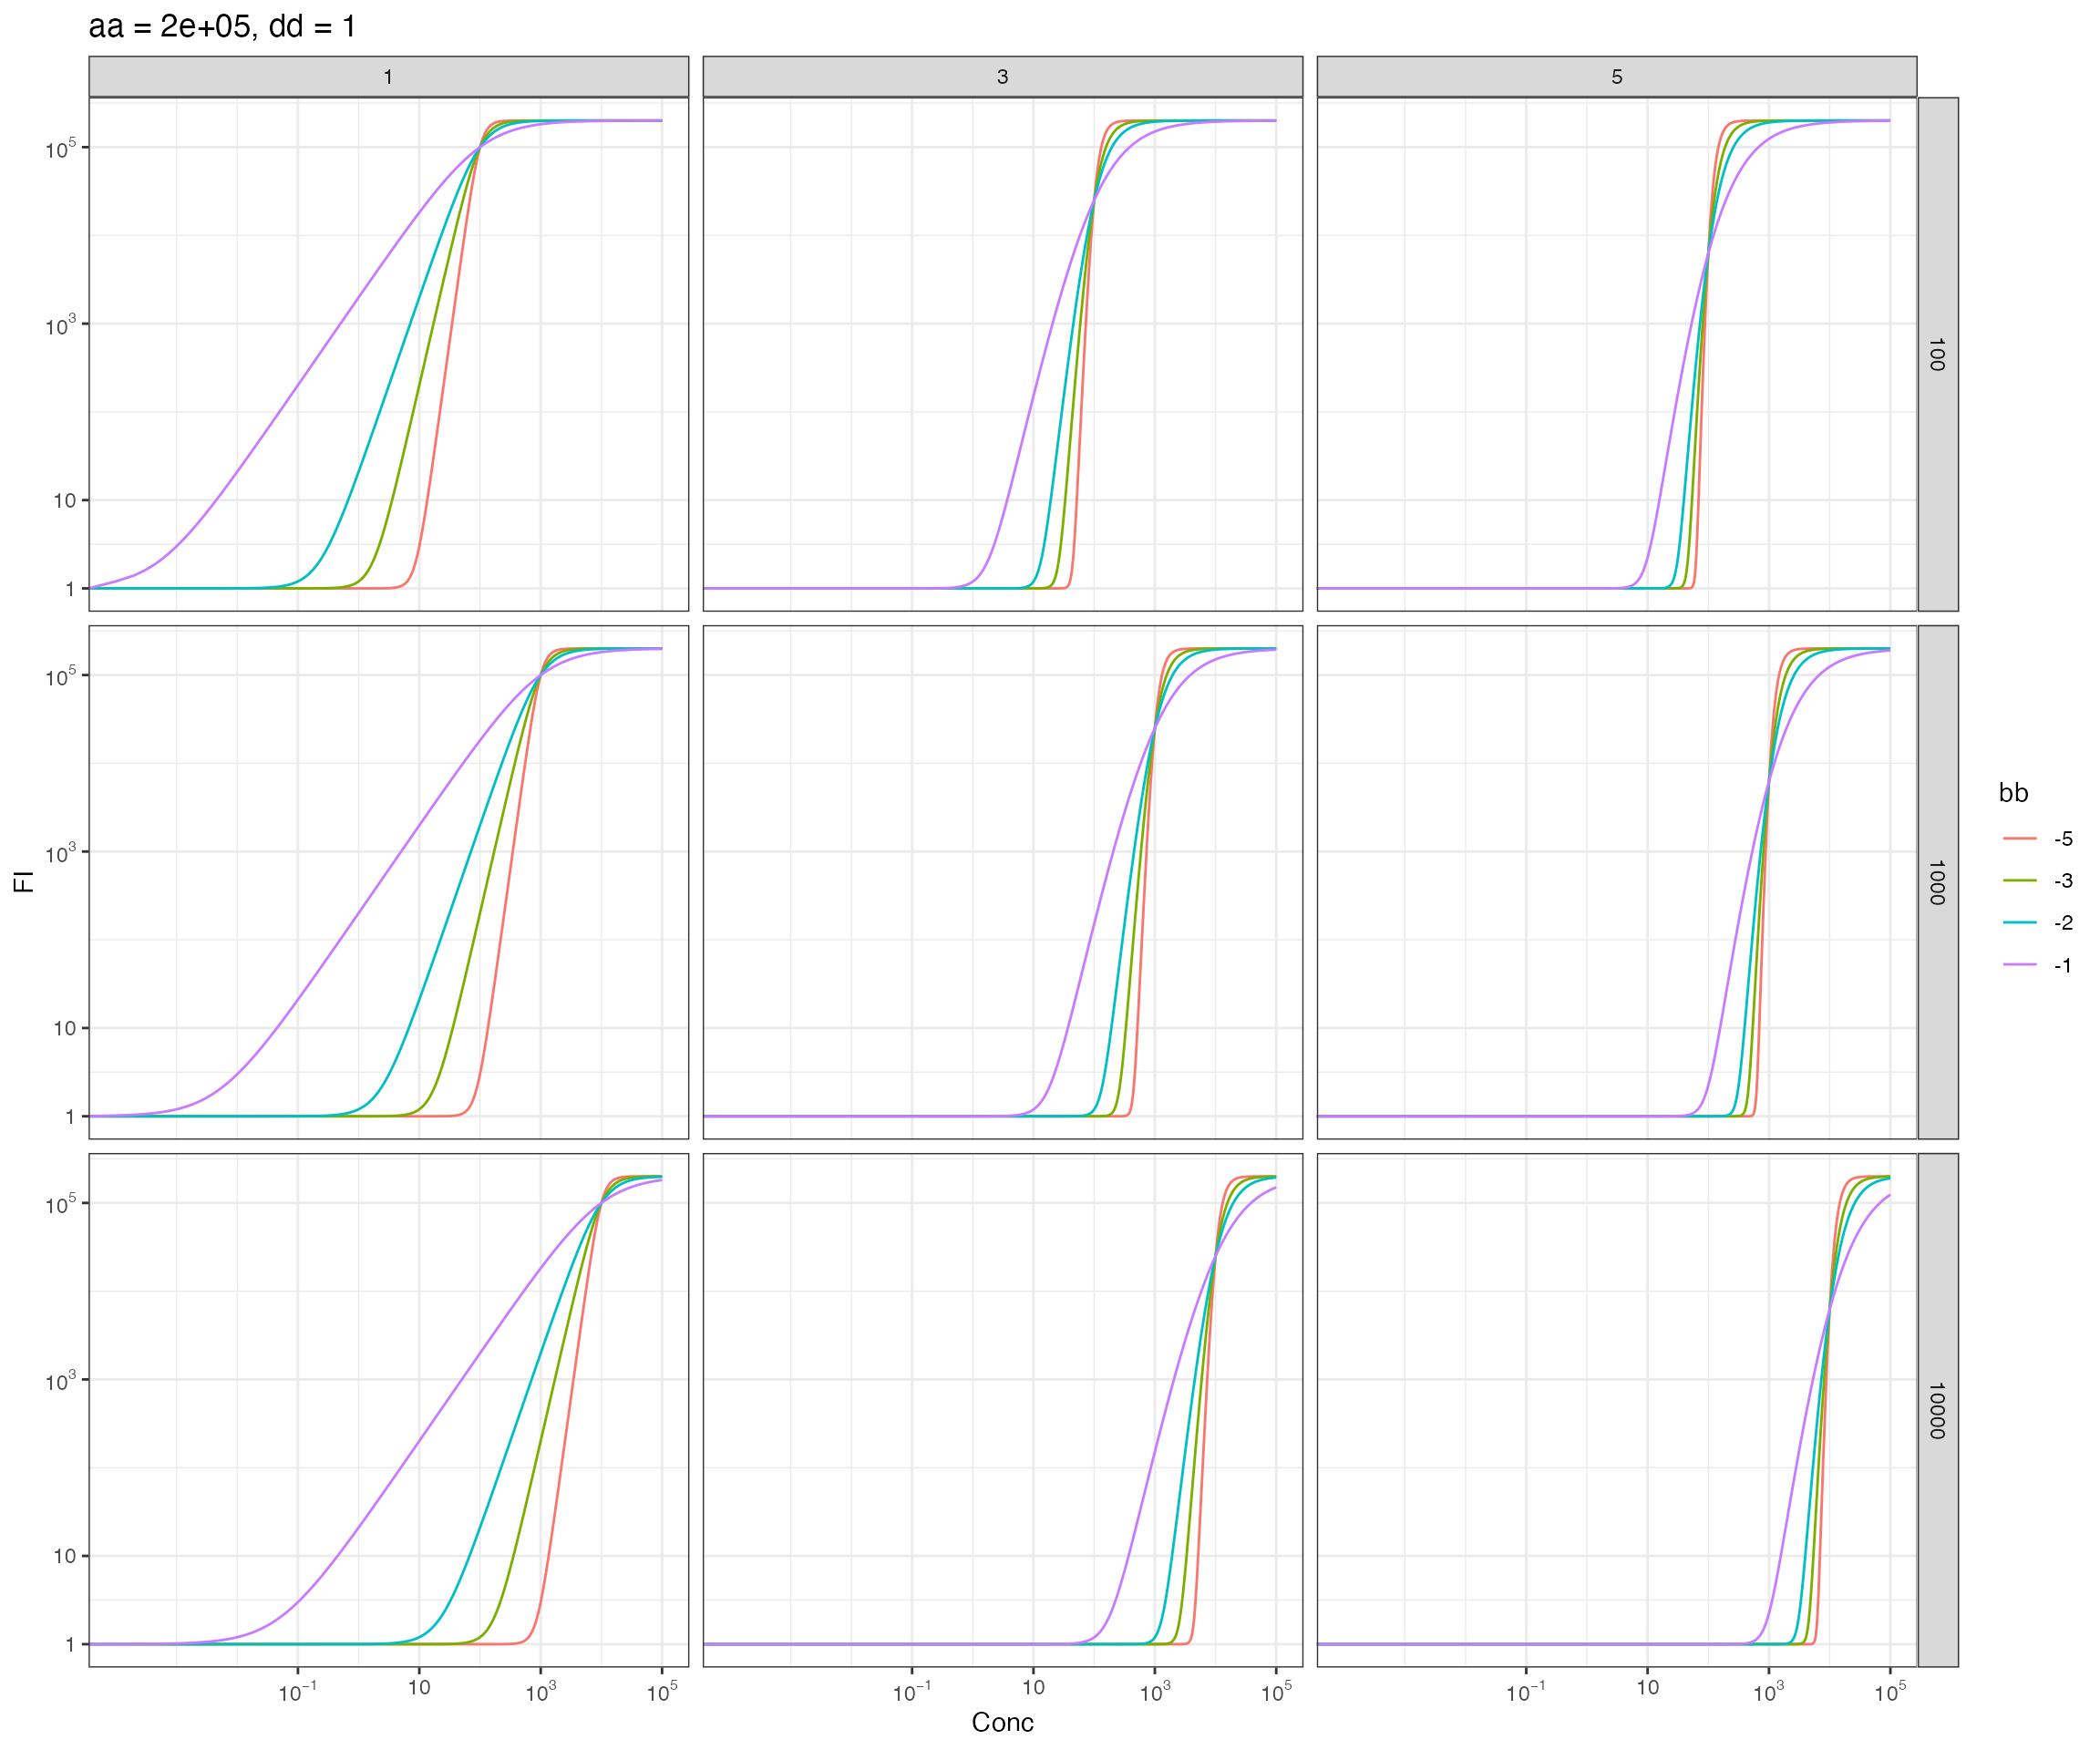
gg_std +
  geom_line(data = scan, aes(x = Conc, y = FI, color = cc)) +
  labs(title = paste0("aa = ",aa, ", dd = ", dd)) +
  facet_grid(rows = vars(bb), cols = vars(ee))
#> Warning: Transformation introduced infinite values in continuous x-axis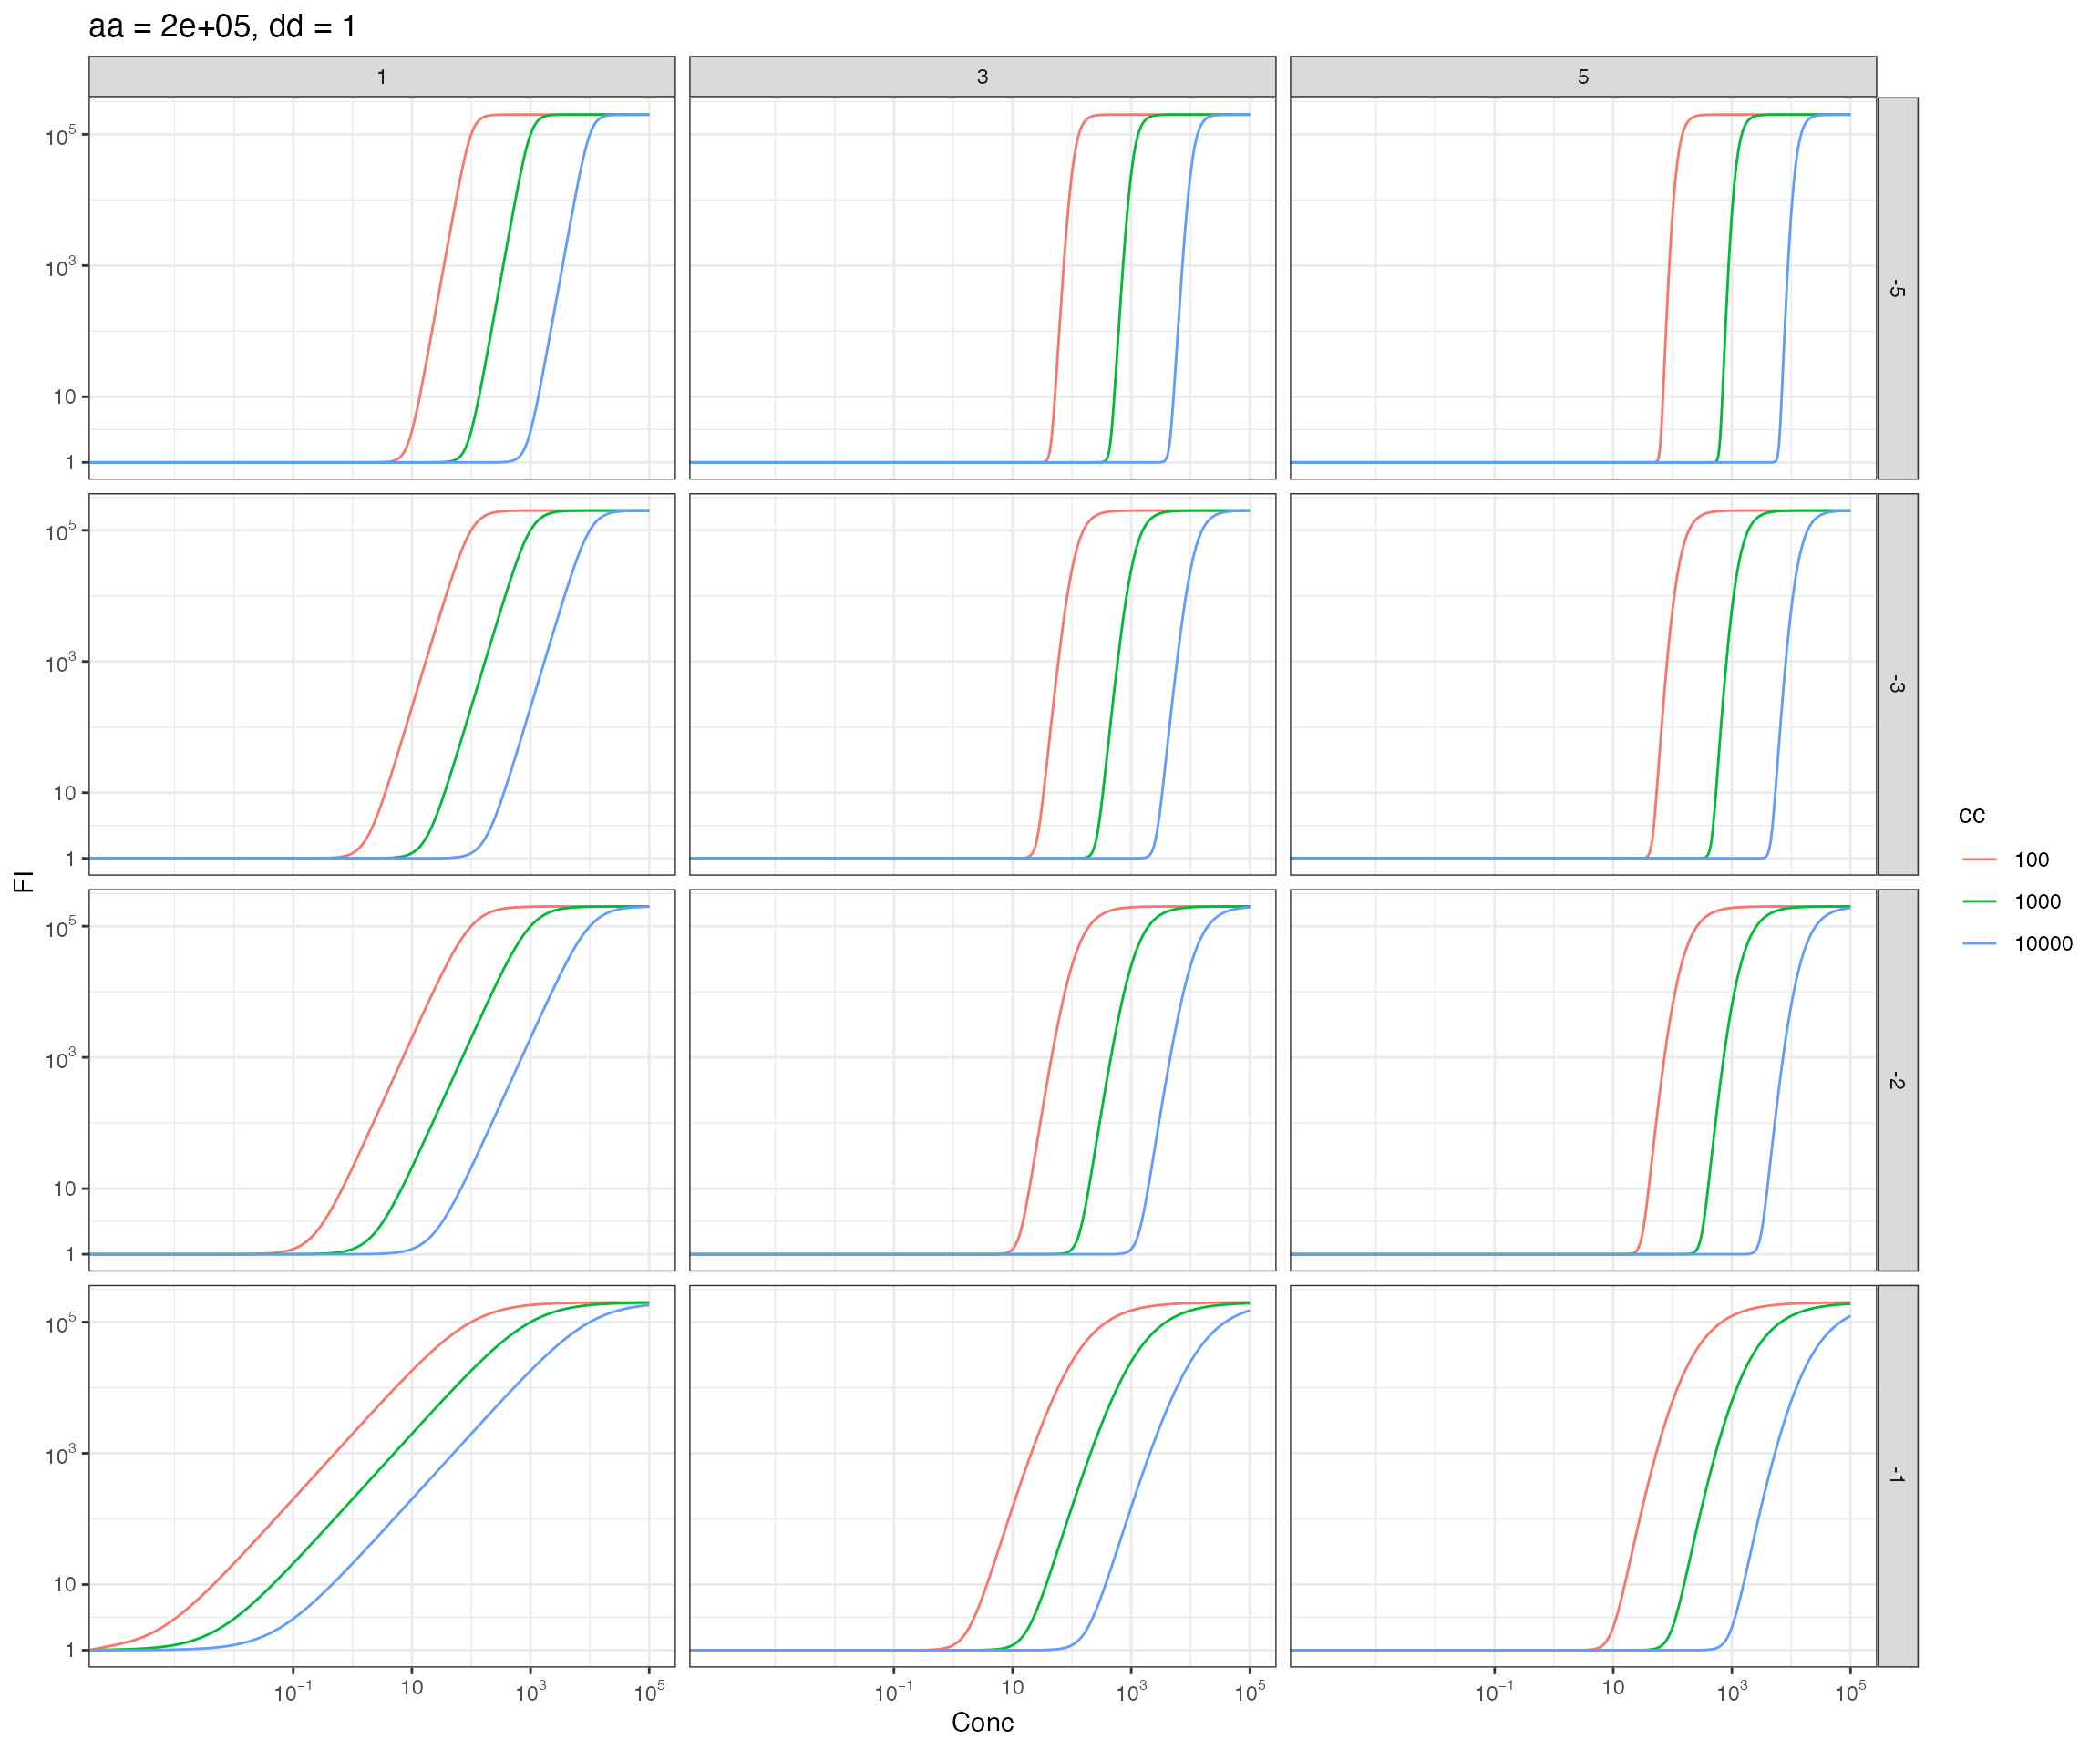
gg_std +
  geom_line(data = scan, aes(x = Conc, y = FI, color = ee)) +
  labs(title = paste0("aa = ",aa, ", dd = ", dd)) +
  facet_grid(rows = vars(bb), cols = vars(cc))
#> Warning: Transformation introduced infinite values in continuous x-axis